I started fiddling around with R again, and ended up playing with a
zipcode database.
So, first I downloaded the zipcode database at Mapping
Hacks, and unpacked the zipfile in
my working directory.
Then, I loaded the data into R
> zips <- read.table("zipcode.csv",sep=",",quote="\"",header=TRUE)
> names(zips)
[1] "zip"       "city"      "state"     "latitude"  "longitude"
[6] "timezone"  "dst"
So, now I have an R frame containing a lot of US cities, their
geographical coordinates, and their zip codes. So we can start playing
with the plot command! After rooting around a bit, I ended up settling
on the smallest footprint plot dot I could make R produce, by setting
the option pch=20 in the plot options. Hence, I ended up with a command
basically like this:
> plot(zips$longitude,zips$latitude,type="p",col=((zips$zip/10000)%%10)+1,pch=20,axes=FALSE,xlab="",ylab="",cex=0.1)
where the +1 after the modulus is to make even 0-values plot, and the
cex parameter sets the point size to something small and pretty.
We can continue this, tweaking the divisor to extract all the other
digits of the zip code, and we end up getting:
> plot(zips$longitude,zips$latitude,type="p",col=((zips$zip/1000)%%10)+1,pch=20,axes=FALSE,xlab="",ylab="",cex=0.1)
> plot(zips$longitude,zips$latitude,type="p",col=((zips$zip/100)%%10)+1,pch=20,axes=FALSE,xlab="",ylab="",cex=0.1)
> plot(zips$longitude,zips$latitude,type="p",col=((zips$zip/10)%%10)+1,pch=20,axes=FALSE,xlab="",ylab="",cex=0.1)
and finally
> plot(zips$longitude,zips$latitude,type="p",col=((zips$zip/1)%%10)+1,pch=20,axes=FALSE,xlab="",ylab="",cex=0.1)
And then, of course, we can zoom in on data too. So we can do things
like extracting Californian zip codes
> cazips <- zips[zips$state == "CA",]
> plot(cazips$longitude,cazips$latitude,type="p",col=((cazips$zip/1000)%%10)+1,pch=20,axes=FALSE,xlab="",ylab="",cex=0.5)
to get
or, we could extract New York zip codes:
> nyzips <- zips[zips$state == "NY",]
> plot(nyzips$longitude,nyzips$latitude,type="p",col=((nyzips$zip/100)%%10)+1,pch=20,axes=FALSE,xlab="",ylab="",cex=0.5)
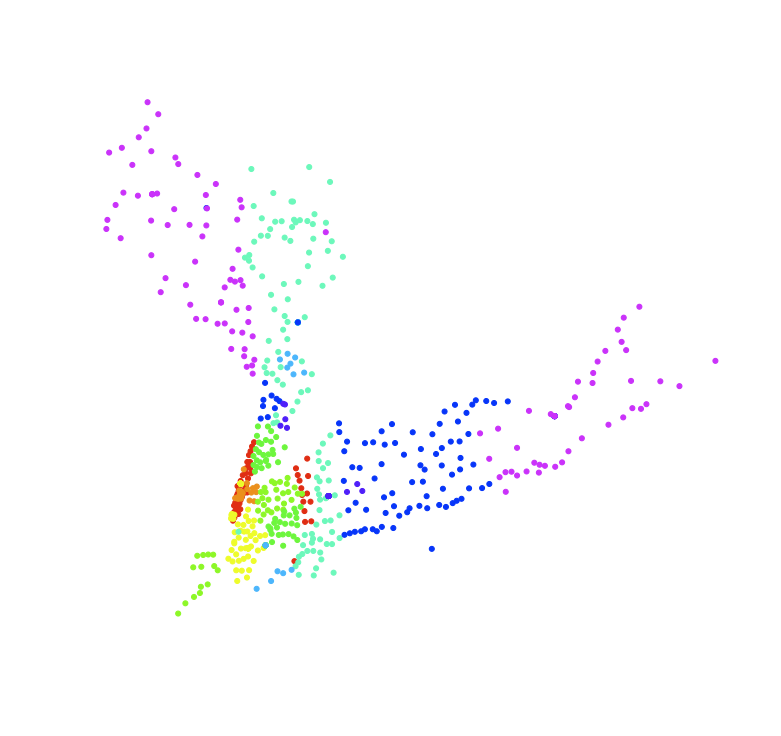
or even extract, say, the zip codes starting with 10 or 11, covering
New York City and surroundings and take a closer look
> ny10zips <- nyzips[nyzips$zip<12000,]
> ny10zips <- ny10zips[ny10zips$zip>9999,]
> plot(ny10zips$longitude,ny10zips$latitude,type="p",col=((ny10zips$zip/100)%%10)+1,pch=20,axes=FALSE,xlab="",ylab="",cex=1.0)