I will be speaking on my research into topological data analysis for political data sets at the University of Edinburgh, at 4:10pm on 15th October, in Room 6206, James Clerk Maxwell Building.
Data Analysis on politics data
Data analysis has played a growing role in politics for many years now; analyzing polling data to predict outcomes of elections is perhaps the most well-known application.
A different approach that has gotten more and more traction lately is to analyze the voting behaviour of elected representatives as a way to understand the inner workings of parliaments, and to monitor the elected representatives to make sure they behave as they once promised. Sites like GovTrack and VoteView bring machine learning and data analysis tools to the citizens, and illustrate and visualize the groupings and behaviour in political administration.
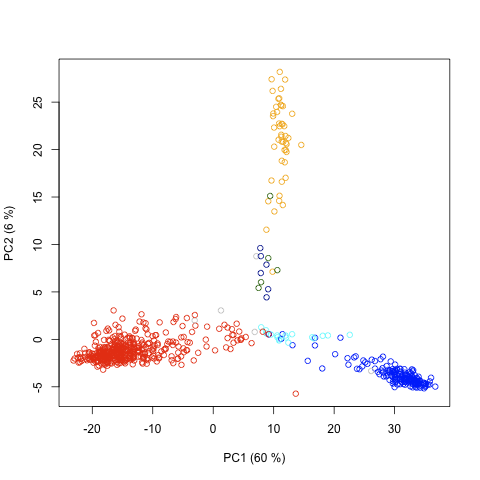
One key step to make parliamentary data accessible for data analysis is to recognize that the data set is inherently geometric; the sequence of votes cast in a parliamentary session can be seen as coordinates for a very high-dimensional vector -- say +1 for Yea, -1 for Nay, and 0 otherwise. This way, each member of parliament is represented by a vector; and members who agree with each other will be close to each other in the resulting vector space.

Topological Data Analysis
Topological Data Analysis is a brand new field of research, where algebraic and combinatorial topology is used to refine geometric methods. Topology encodes «closeness» and provides a robust approach to qualitative features in data sets.
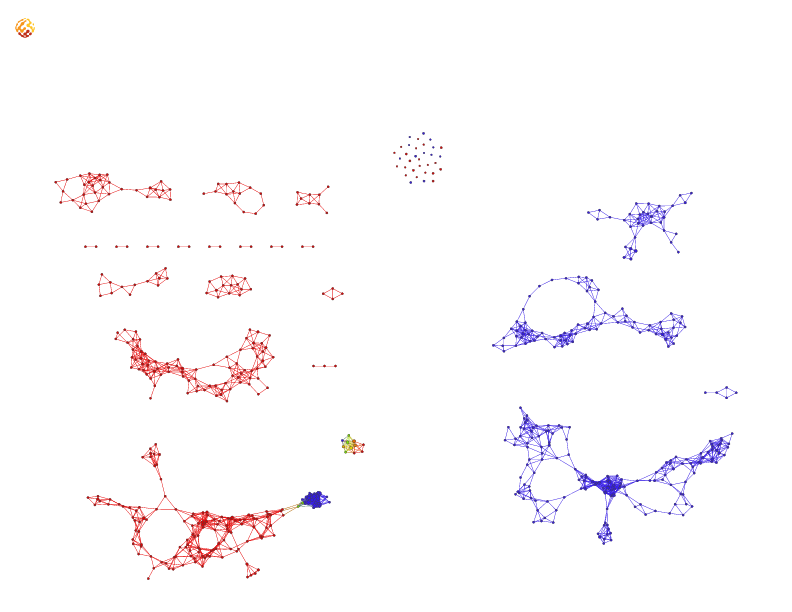
In particular, for the political data, we are using a technique called Mapper. This technique, invented in the Applied Topology group at Stanford, produces easy to analyze topological models induced by point clouds: the points are divided using measurement functions, and then clustered into closely connected groups. Whenever groups overlap, they are connected, producing a simplified model for the space suggested by the data points.
Applying this on topological data, we can discover sub-groups in the US House of Representatives that were not visible by a PCA dimension reduction. Not only that, but we can measure political unrest by the fragmentation of parliament into larger or smaller interest groups.
 |
 |
 |
| 2009 | 2010 | 2011 |
Mapper analyses of House of Representatives voting records, using Iris from Ayasdi.